Home Tours as a Measure of the Market
[ad_1]
We’ve measured the pandemic’s effects on the real estate market by examining where renters and buyers find the most indoor space, by counting adults moving back home with their parents, by tracking late housing payments, by revealing pandemic home design trends, and by looking at the supply (low) and demand (high) that has created a seller’s market.
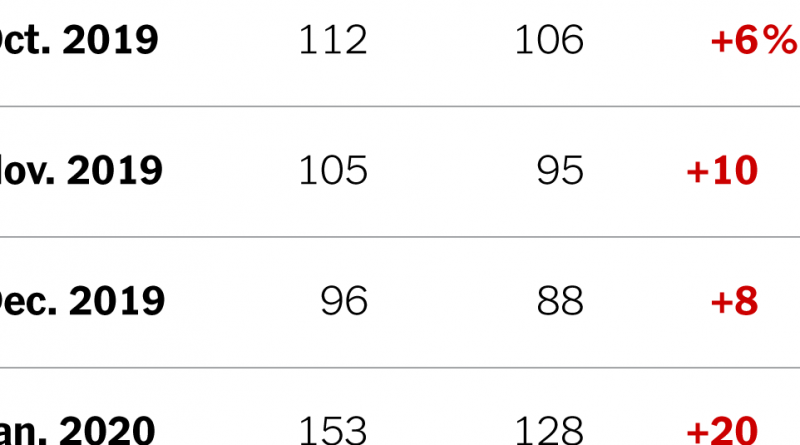
The ShowingTime Showing Index measures demand another way: by comparing the number of booked appointments for virtual or in-person showings to the number of properties available. It’s a forward-looking index, explained Michael Lane, president of ShowingTime. “There aren’t that many that are giving you a feel for what’s happening for upcoming sales.”
The index uses January 2014 showings as a baseline set at a score of 100, so a score of 150 would indicate a 50 percent increase over 2014’s rate of showings. The more views per property, the higher the index rises.
This week’s chart, outlining the past eight months of showing data, confirms the recent spike in demand for new homes, with a dip in showings during the spring counteracted by a huge upswing as summer turned to fall.
In March, when the pandemic began halting showings altogether in many areas, the national index slipped to 128 from 157 in March 2019, an 18 percent drop. In April, it plunged 42 percent year over year, from 147 to 85.
The figures below are drawn from ShowingTime’s scheduling products, which are used to book home showings by many of the major brokerages including Coldwell Banker, Sotheby’s, Century 21, Douglas Elliman, Compass, Redfin and others. In September, about seven million showings were booked nationally, raising the total for 2020 to just over 60 million.
While the rebound is good for sellers and brokers who make those sales, for buyers it’s a further illustration of how challenging it is to buy a home today. There just aren’t enough to go around.
For weekly email updates on residential real estate news, sign up here. Follow us on Twitter: @nytrealestate.
